Cost per knock and cost per lead are standard metrics in any canvassing program. The harder part is calculating them correctly and using them together to answer the question that actually matters: is the canvassing software paying for itself?
This article breaks down the formulas for cost per knock, cost per lead, and cost per sale, then shows how to combine them into a defensible canvassing software ROI calculation for 2026.
For sales teams, that means using canvassing data to connect field activity, customer interactions, and closed revenue, rather than relying solely on the number of doors knocked.
Canvassing Software ROI: How to Calculate Cost per Knock, Lead, and Sale in 2026
For most sales managers, doors knocked is the default gut-check metric for canvassing productivity and the first number pulled up on any dashboard.
But field sales ROI depends on more than activity volume. It also depends on lead tracking, data accuracy, customer acquisition costs, and how much revenue those leads eventually produce.
Below, we break down the exact formulas for cost per knock, cost per lead, and cost per sale, and show how each one fits into the larger question of whether your canvassing software is actually profitable.
Key Takeaways
- Cost per knock = total canvassing cost ÷ doors knocked. It measures field activity efficiency.
- Cost per lead = total canvassing cost ÷ qualified leads. It shows how efficiently knocking generates opportunities.
- Cost per sale and gross-profit ROI determine whether canvassing is profitable.
- Use fully loaded costs and one consistent definition of a qualified lead.
- Measure canvassing software ROI against performance before the software was introduced.
Track Canvassing Metrics in One Place
Track door knocks, leads, conversions, and territory performance with Knockbase Canvassing Software, giving your team complete visibility into field sales performance.
Explore Knockbase Canvassing Software
Cost per Knock vs Cost per Lead: What’s the Difference?
Cost per knock and cost per lead measure different stages of the canvassing funnel. One tracks how efficiently your team creates activity; the other shows how effectively that activity produces qualified opportunities.
| Metric | Formula | What It Measures | Main Limitation |
|---|---|---|---|
| Cost per knock | Total canvassing cost ÷ doors knocked | Field activity efficiency | Does not show lead quality or revenue |
| Cost per lead | Total canvassing cost ÷ qualified leads | Lead-generation efficiency | Does not show whether leads convert |
| Cost per sale | Total canvassing cost ÷ closed sales | Customer acquisition efficiency | Must be compared with gross profit |
| Canvassing ROI | Net gross profit ÷ canvassing cost | Overall profitability | Requires accurate cost and sales attribution |
These metrics work best together. A low cost per knock may look efficient, but it means little if few conversations turn into qualified leads or sales.
Start With the Full Cost of Your Canvassing Program
Every ROI calculation depends on the cost number you start with. If the cost base is incomplete, your unit economics will all look better than they actually are. Before calculating performance, define what you are including in the total canvassing cost.
1. Field Team Costs
Field team costs include the direct expenses required to get reps into the territory and keep them working. This usually includes:
- Rep wages
- Payroll taxes and benefits
- Commissions and bonuses
- Fuel and travel
- Mobile devices and data
- Printed materials
These costs are especially useful when comparing reps, teams, routes, or territories because they show how much it costs to create field activity.
2. Management and Technology Costs
A complete canvassing ROI calculation should also include the cost of managing and supporting the program. This may include:
- Sales canvassing software
- Sales manager time
- Training and onboarding
- Administrative support
- CRM integration or connected CRM systems
- Reporting tools or performance tracking dashboards
Leaving these costs out can make the program look more profitable than it is, especially when comparing canvassing against other lead-generation channels.
3. Operational Cost vs. Fully Loaded Cost
Sales managers can use different cost bases depending on the question they are trying to answer.
- Operational cost is useful for short-term decisions, such as comparing rep productivity, territory management, or weekly field performance.
- Fully loaded cost is better for ROI analysis because it includes the broader cost of running the canvassing program, not just the cost of field activity.
Whichever cost base you choose, use it consistently throughout the calculation. Mixing operational costs in one metric and fully loaded costs in another can make cost per knock, cost per lead, and ROI difficult to compare accurately.
If you're looking to eliminate disconnected sales processes, see how Knockbase fits into your existing workflow without disrupting your team's operations.
How to Calculate Cost per Knock and Cost per Lead?
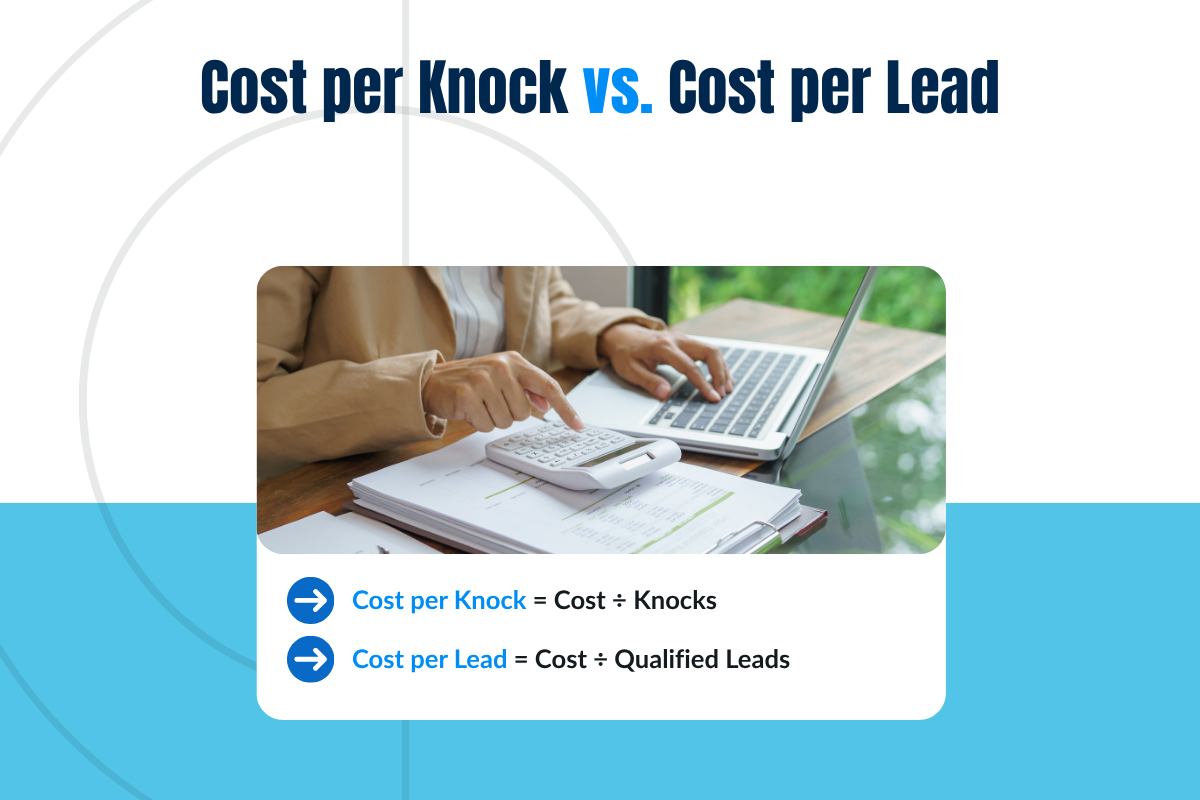
Once you have a consistent cost base, you can calculate the two core activity metrics: cost per knock and cost per lead.
1. Cost-per-Knock Formula
Cost per knock shows how much it costs your team to generate one door knock.
Cost per knock = Total canvassing cost ÷ Total doors knocked
For example:
- Monthly canvassing cost: $16,000
- Doors knocked: 8,000
- Cost per knock: $2
A rising cost per knock usually means the team is spending more to create the same amount of field activity. That may point to low knocks per field hour, excessive travel time, poor territory planning, overlapping rep activity, weak route planning, or too many manual processes pulling reps away from the field.
Cost per knock is useful for identifying productivity issues, but it should not be treated as the final measure of success. A team can knock efficiently and still generate weak leads.
2. Cost-per-Lead Formula
Cost per lead shows how much it costs to generate one qualified canvassing lead.
Cost per lead = Total canvassing cost ÷ Qualified leads generated
For example:
- Monthly canvassing cost: $16,000
- Qualified leads: 120
- Cost per lead: $133.33
This metric helps sales managers understand whether field activity is turning into real opportunities. If cost per knock is stable but cost per lead is rising, the issue may not be productivity. It may be territory quality, targeting, timing, rep pitch, or lead qualification.
How to Define a Qualified Canvassing Lead
Before calculating cost per lead, define what counts as a qualified lead. Otherwise, the number can be inflated by door answers or weak prospects unlikely to convert.
A qualified canvassing lead should usually include:
- A relevant homeowner or decision-maker
- Valid contact information
- A confirmed service need or interest
- Permission for follow-up
- An appointment booked or a clear agreed next step
A door answer is merely a contact point, not an opportunity. Standardizing what constitutes a 'qualified lead' across all field teams is vital for accurate CPL tracking.
Better territory coverage starts with efficient routing—see how optimized sales routes can help your team reach more prospects in less time.
How to Interpret Cost per Knock and Cost per Lead Together?
Looking at cost per knock alongside cost per lead provides a clearer picture of both effort and outcome. One reflects how much it costs to generate activity in the field, while the other indicates how effectively that activity produces viable prospects.
| Cost per Knock | Cost per Lead | Likely Meaning | Recommended Action |
|---|---|---|---|
| Low | Low | Efficient activity is producing leads | Consider scaling |
| Low | High | Reps are knocking efficiently, but leads are not converting | Review territory, timing, targeting, and pitch |
| High | Low | Activity is expensive, but lead volume is strong | Check close rates and margins before cutting costs |
| High | High | Productivity is low, and lead generation is weak | Diagnose the campaign before investing more |
For example, a low cost per knock may look positive at first. But if cost per lead is high, the team may be knocking many doors in the wrong territory or speaking to people who are unlikely to qualify.
A high cost per knock is not always bad either. If the campaign is producing high-quality leads that close at strong margins, the higher activity cost may still be acceptable.
To understand what is driving either metric, track supporting funnel metrics such as:
- Knocks per field hour
- Contact rate
- Leads per 100 knocks
- Appointment-booking rate
These numbers help sales managers identify whether the problem is field productivity, territory quality, lead qualification, or conversion after the first conversation.
They also help managers refine strategies based on their own data instead of guessing. For example, if one territory has strong contact rates but weak lead quality, the issue may be targeting.
If another has strong lead quality but low activity volume, the issue may be time spent traveling or inefficient route coverage.
How to Connect Lead Costs to Cost per Sale?
Cost per lead shows how efficiently canvassing generates opportunities, but it does not show whether those opportunities become profitable customers.
To understand the actual acquisition cost, connect lead costs to closed sales.
Cost per sale = Total canvassing cost ÷ Closed sales from canvassing
For example, if a canvassing program costs $16,000 in a month and produces 12 closed sales, the cost per sale is $1,333.33.
This matters because two campaigns can have the same cost per lead but very different outcomes for revenue generation. One may generate leads that book appointments, show up, and close at strong margins.
Another may produce the same number of leads but lose value through no-shows, weak lead-to-sale conversion, lower average contract value, poor gross margin, or cancellations.
That is why cost per lead should always be evaluated alongside downstream sales metrics.
Calculate the Maximum Allowable Cost per Lead
Sales managers can also calculate the highest cost per lead the canvassing program can support before it becomes unprofitable.
Maximum allowable CPL = Gross profit per sale × Lead-to-sale conversion rate
For example:
- Gross profit per sale: $3,600
- Lead-to-sale rate: 10%
- Break-even CPL: $360
In this case, the company can spend up to $360 per qualified lead before the campaign breaks even on gross profit.
The actual target CPL should normally be lower than the break-even figure. This leaves room for overhead, sales management costs, software, cancellations, and profit.
How to Calculate Canvassing and Software ROI?
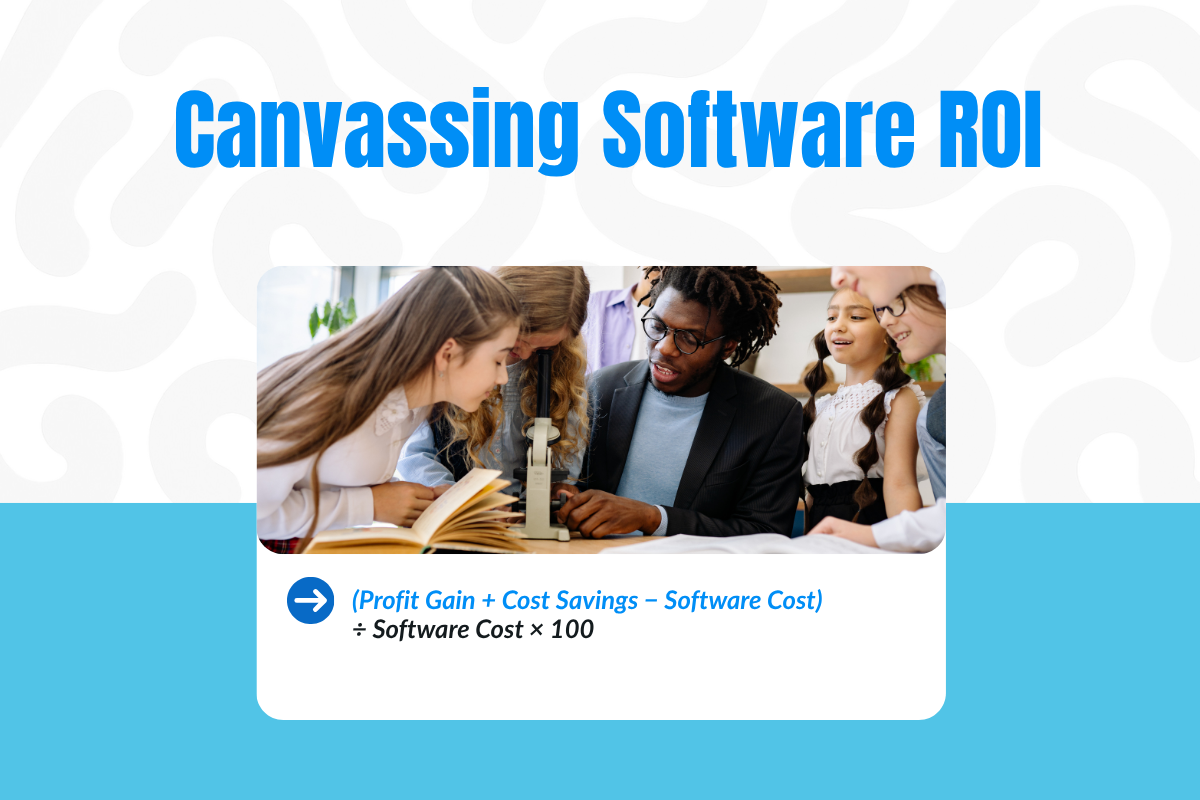
Cost per knock, cost per lead, and cost per sale show how efficiently your canvassing program moves through the funnel. ROI shows whether the program is profitable.
Use gross profit instead of total sales revenue because revenue does not account for the cost of delivering the work.
Canvassing ROI = (Gross profit from canvassing sales − Total canvassing cost) ÷ Total canvassing cost × 100
Worked Canvassing ROI Example
| Input | Monthly Result |
|---|---|
| Total canvassing cost | $16,000 |
| Doors knocked | $8,000 |
| Qualified leads | 120 |
| Appointments booked | $48 |
| Closed sales | $12 |
| Average gross profit per sale | $3,600 |
Using these numbers:
- Cost per knock: $2
- Cost per lead: $133.33
- Cost per appointment: $333.33
- Cost per sale: $1,333.33
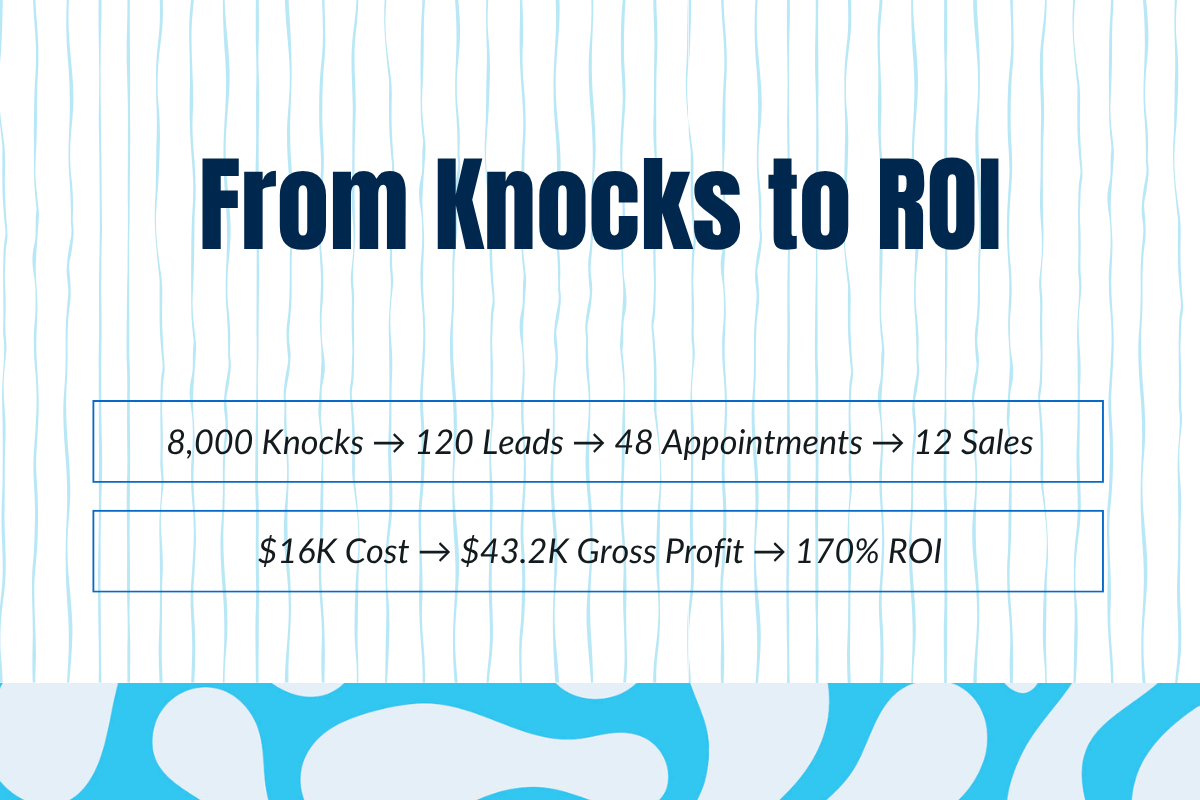
- Total gross profit: $43,200
- Canvassing ROI: 170%
In this example, the program generates $43,200 in gross profit from $16,000 in total canvassing cost. After subtracting the cost, it produces $27,200 in net profit, resulting in a 170% ROI.
Note: Actual ROI depends on labor costs, territory density, lead quality, close rate, average contract value, gross margin, and cancellation rate.
How to Measure Canvassing Software ROI Separately
Canvassing ROI and canvassing software ROI answer different questions.
- Canvassing ROI: Is the overall canvassing channel profitable?
- Canvassing software ROI: Did the software improve performance enough to justify its cost?
To calculate software ROI, isolate the improvements that happened after the software was introduced.
Software ROI = (Incremental gross profit + operational savings − software cost) ÷ software cost × 100
Start with a pre-software baseline using metrics such as knocks per field hour, lead and appointment conversion rates, cost per lead and cost per sale, gross profit per rep, follow-up speed, and territory overlap.
Then compare that baseline against performance after implementation.
Software-driven improvements may include route optimization, reduced drive time, fewer duplicate visits, better territory coverage, faster lead handoffs, more accurate attribution, better follow-up compliance, less manual reporting, cost savings, and improved rep accountability.
Mobile canvassing software can also improve operational efficiency by giving sales reps mobile access to update notes, outcomes, and lead status in the field.
Real-time tracking and data syncing make it easier for managers to monitor performance, review team performance, and reduce manual data-entry errors.
Example: Manual Mapping vs Software
Consider two companies with five sales reps operating in comparable territories over the same one-month period.
Company A uses paper maps, spreadsheets, and manual lead handoffs. Company B uses software to assign territories, optimize routes, record outcomes, and sync lead information in real time.
| Metric | Company A: Manual Mapping | Company B: Software |
|---|---|---|
| Total field hours | $600 | $600.00 |
| Route planning and reporting hours | $80 | $40.00 |
| Doors knocked | 2,400 | $3,000.00 |
| Qualified leads | $72 | $90.00 |
| Closed sales | $9 | $11.00 |
| Gross profit per sale | $2,000 | $2,000.00 |
| Total gross profit | $18,000 | $22,000 |
By reducing route-planning and reporting work, Company B saves 40 hours per month. At an estimated labor cost of $25 per hour, that creates $1,000 in operational savings.
Company B also closes two additional sales, generating $4,000 in incremental gross profit.
Assuming Knockbase costs $1,500 for the month:
Software ROI = ($4,000 + $1,000 − $1,500) ÷ $1,500 × 100
Software ROI = 233%
In this scenario, every dollar spent on the software produces approximately $2.33 in net return after accounting for the software cost.
These figures are illustrative rather than universal benchmarks. You would still need to confirm that the improvement was not primarily due to stronger seasonal demand, more experienced reps, territory changes, price increases, or parallel advertising campaigns.
Compare Canvassing With Other Lead Channels Fairly
Cost per lead can be misleading when different channels define a “lead” differently.
A canvassing lead, paid lead, referral, digital marketing lead, or digital ads form submission may all have different quality levels, conversion rates, and follow-up costs.
1. Use the Same Lead Definition
Start by making sure you are comparing the same type of lead.
A qualified canvassing appointment should not be compared directly with an unverified digital form submission. If one channel produces booked appointments and another produces raw contact details, the cost per lead will not tell the full story.
Use the same qualification standard across channels wherever possible.
2. Include the Fully Loaded Cost of Each Channel
Canvassing costs should include labor, management, travel, training, and technology.
Digital or purchased leads should also include more than the ad spend or lead fee. Add agency costs, qualification labor, follow-up labor, CRM costs, and any tools used to manage or convert those leads.
This gives sales managers a more realistic comparison instead of making one channel look cheaper because key costs were left out.
3. Compare Downstream Economics
The best channel is not always the one with the lowest cost per lead. Compare each channel by looking at:
- Cost per appointment
- Appointment show rate
- Lead-to-sale conversion rate
- Cost per sale
- Gross profit per sale
- Cancellation rate
- Customer lifetime value, where relevant
A channel with a higher cost per lead may still be more profitable if it produces better appointments, stronger close rates, larger deals, or fewer cancellations.
What Sales Managers Should Track Weekly and Monthly?
Canvassing metrics are easier to use when they are reviewed at the right frequency. Some key performance indicators help managers correct field activity quickly, while others need a longer window to show campaign performance, average revenue, and profitability.
1. Weekly Operational Metrics
Weekly reporting should focus on field execution and early funnel performance.
Track: field hours, doors knocked, knocks per hour, contact rate, leads per 100 knocks, cost per knock, cost per lead, and appointments booked
These metrics help managers catch problems early, such as low productivity, weak territory coverage, poor contact rates, or falling lead quality.
2. Monthly Profitability Metrics
Monthly reporting should focus on whether canvassing is turning into profitable sales.
Track: appointment show rate, lead-to-sale rate, cost per sale, average contract value, gross profit per sale, gross profit per field hour, canvassing ROI, and software ROI.
These metrics show whether the canvassing program is worth continuing, scaling, or adjusting.
For better analysis, break the data down by rep, team, territory, campaign, day and time, and lead source or disposition. Averages can hide major differences between top-performing and underperforming routes, sales reps, or campaigns.
Accuracy Checks Before Presenting Canvassing ROI
Before presenting canvassing ROI, check whether the underlying numbers are reliable enough to support decisions about hiring, budgeting, territory, or software.
1. Account for Rep Ramp-Up Periods
Separate new representatives from experienced team members when reviewing performance.
New reps may knock fewer doors, generate fewer qualified leads, or close fewer sales while learning the pitch, territory, and sales process. Combining their results with experienced reps can distort team-level averages.
2. Standardize the Lead Definition
Use the same definition of a qualified lead across every team and territory. Do not allow one team to count every door conversation while another only counts homeowners who provide valid contact information or book an appointment.
3. Set a Clear Attribution Window
Decide how long after the initial door contact a sale can still be attributed to canvassing. A seven-day window may work for short sales cycles, while roofing, solar, or other higher-value services may require a longer period. The same attribution rule should be applied consistently across campaigns.
4. Compare Similar Territories
Territory density, household income, competition, weather, property type, and local demand can all affect canvassing results.
Avoid treating performance differences as rep or software problems when the teams are operating in substantially different market conditions.
5. Adjust for Seasonality and Pricing Changes
A strong or weak month may reflect seasonal demand rather than a change in campaign quality. Pricing increases, promotions, storm activity, weather conditions, and service availability should also be considered before attributing performance changes to the canvassing strategy.
6. Remove Canceled or Refunded Sales
Only include revenue and gross profit from sales that remain valid. Canceled contracts, refunded purchases, failed financing applications, and uncompleted jobs should be removed from the final ROI calculation.
7. Segment Results Before Relying on Averages
Company-wide averages can hide major performance differences. Break results down by rep, team, territory, campaign, time period, and lead outcome to identify where canvassing is actually producing profitable results.
Why Choose Knockbase for Canvassing ROI Tracking?
Knockbase helps sales managers connect field activity with lead outcomes, so ROI is easier to measure and improve.
With Knockbase, teams can:
- Plan smarter routes: Reduce wasted travel time and improve territory coverage.
- Track rep activity in real time: See doors knocked, leads captured, appointments booked, and team performance from one place.
- Capture leads in the field: Reps can log notes, update outcomes, and schedule follow-ups from their phones.
- Improve accountability: Managers can compare reps, territories, and campaigns without relying on manual reporting.
- Measure what matters: Connect knocks, leads, appointments, conversions, and territory performance to understand what is actually driving revenue.
Instead of guessing whether canvassing is working, Knockbase gives sales managers the data they need to refine strategy, coach reps, and improve ROI.
If your team needs more than a door-knocking app, explore how Knockbase supports lead management, territory planning, and performance tracking.
The Bottom Line: Optimize for Profitable Sales, Not Just More Knocks
More doors knocked does not always mean a stronger canvassing program. Cost per knock helps sales managers spot field productivity issues, while cost per lead shows whether that activity is creating real opportunities.
From there, cost per sale connects canvassing spend to actual customer acquisition. Gross-profit ROI then indicates whether the program warrants further investment.
The same logic applies to canvassing software. It creates value only when it improves performance against the team’s previous baseline, such as better territory coverage, faster follow-up, lower admin work, or stronger lead outcomes.
Track Canvassing ROI With Knockbase
See how Knockbase helps sales managers streamline operations, track performance, and connect canvassing activity with lead outcomes and territory performance in one place.
Frequently Asked Questions
How do I track rep attribution when two reps knock the same door, or a mailer converts later?
Enforce a strict 30-to-60-day disposition lock in your canvassing software so the initial rep holds lead ownership within that window. Combine this with unique rep-level QR codes on physical leave-behind flyers to track late digital conversions back to the original canvasser.
What Is a Good Cost per Lead for Door-to-Door Sales?
A good cost per lead depends on gross profit per sale and lead-to-sale conversion rate. Use this formula: maximum allowable CPL = gross profit per sale × lead-to-sale conversion rate.
Is Cost per Lead More Important Than Cost per Knock?
Cost per lead is closer to revenue, but cost per knock is still important. Cost per knock measures field productivity, while cost per lead shows whether that activity creates qualified opportunities.
How Do You Calculate Cost per Sale From Canvassing?
Cost per sale = total canvassing cost ÷ closed sales from canvassing. It shows how much the company spends to acquire one customer through canvassing.
How do I factor rep turnover and ramp-up time into my ROI model without ruining the baseline?
Isolate your metrics into two separate cohorts: Ramp (0–60 days) and Tenured. Track onboarding salaries and tech seats as fixed program overhead rather than inflating your tenured rep CPL, and adjust new-hire capacity expectations (30% in Month 1, 60% in Month 2) in your forecasts.
Which Canvassing Metrics Should Sales Managers Track?
Sales managers should track doors knocked, knocks per hour, contact rate, leads per 100 knocks, cost per knock, cost per lead, appointments booked, cost per sale, canvassing ROI, and software ROI.